

Author
Michael Benson
CEO of Cubes.Co
Track Office Utilisation, Peak Occupancy and Workspace Costs
An office can feel empty on Monday and overcrowded on Wednesday. Meeting rooms can be fully booked while rows of desks sit unused. For enterprise workplace and HR teams, those mixed signals make space planning difficult.
Office utilisation helps explain what is happening. It reveals how much workspace is used, when demand rises and whether the office supports the work people come in to do.
For hybrid teams, the goal is to match capacity, cost and workplace experience to actual demand. Tracking the right metrics helps leaders identify where traditional offices fall short and when flexible workspace deserves a closer look.
What is office utilisation?
Office utilisation measures how much available workspace is actually used over a defined period. It can be assessed across desks, meeting rooms, floors or an entire corporate office space.
Office occupancy describes how many people are present at a particular time. Workplace utilisation adds context about how spaces are used throughout the day or week.
These terms are not applied consistently across every reporting platform. Before comparing locations, distinguish between:
- Attendance: Unique people who visit during a day.
- Occupancy: People present or workstations in use at a particular time.
- Time-based utilisation: The proportion of available desk-hours or room-hours actually used.
A building entry record confirms a visit. It does not establish that someone occupied a desk for eight hours.
Why traditional offices can stay underused in hybrid work
Traditional offices may have been planned around total headcount and individually assigned desks. Hybrid work changes the relationship between workforce size and daily space requirements.
Underuse can emerge when:
- Teams attend on the same days, leaving capacity idle elsewhere in the week.
- Assigned desks remain reserved while their owners work remotely.
- Employees need quiet rooms or project areas, but the office mostly provides open-plan desks.
- A central location does not suit a geographically dispersed workforce.
- Space commitments remain fixed while team size and working patterns change.
These are different problems. Some require better coordination or layout adjustments. Others justify reviewing the size, location or commercial structure of the workplace.
Seven office utilisation metrics to track
1. Average desk occupancy
Average desk occupancy shows the share of usable desks occupied across repeated observations.
Formula: Total occupied desks across observations ÷ total available desks across those observations × 100.
For example, if a 100-desk office averages 42 occupied desks across equally spaced observations, average desk occupancy is 42%.
Measure consistently throughout the working day and across the week. A single lunchtime count will not provide the same picture as regular observations.
What it reveals: Whether desk capacity is broadly aligned with everyday demand. It is a starting point, rather than sufficient evidence for reducing space.
2. Peak occupancy and busy-period demand
Peak occupancy captures the highest number of people or occupied workstations recorded at the same time during the reporting period.
Formula for peak desk occupancy: Highest simultaneous occupied desk count ÷ available desks at that time × 100.
Also review the 95th percentile of sampled occupancy, meaning the level at or below which 95% of observations fall. This helps distinguish typical busy conditions from an exceptional event.
What it reveals: How much capacity you need when demand is high.
Review recurring peaks alongside onboarding, training and client workshops before changing your footprint. A workplace sized entirely around average attendance may struggle when teams gather.
3. Occupancy by day and time
Break office occupancy into weekdays and consistent time bands. This reveals patterns that a weekly average can conceal.
The following is an illustrative example, not an industry benchmark:
| Day | Average occupied desks | Available desks | Average desk occupancy |
|---|---|---|---|
| Monday | 25 | 100 | 25% |
| Tuesday | 70 | 100 | 70% |
| Wednesday | 85 | 100 | 85% |
| Thursday | 60 | 100 | 60% |
| Friday | 20 | 100 | 20% |
The weekly average is 52%, but Wednesday already averages 85%. Its busiest hour could be higher still.
What it reveals: Whether the office has consistently excess space or uneven demand.
Coordinated attendance, shared desks or access to overflow space may help address uneven demand before a major property decision is needed.
4. Desk utilisation over time
Time-based desk utilisation measures how long desks are actually in use.
Formula: Occupied desk-hours ÷ available desk-hours × 100.
For example, 50 desks available for eight hours provide 400 available desk-hours. If measured use totals 160 desk-hours, utilisation is 40%.
Use a consistent definition of occupied time, including how short breaks are treated. Booking duration alone is not evidence of actual desk use.
What it reveals: Whether desks support sustained work or short visits, and whether shared seating could better accommodate those patterns.
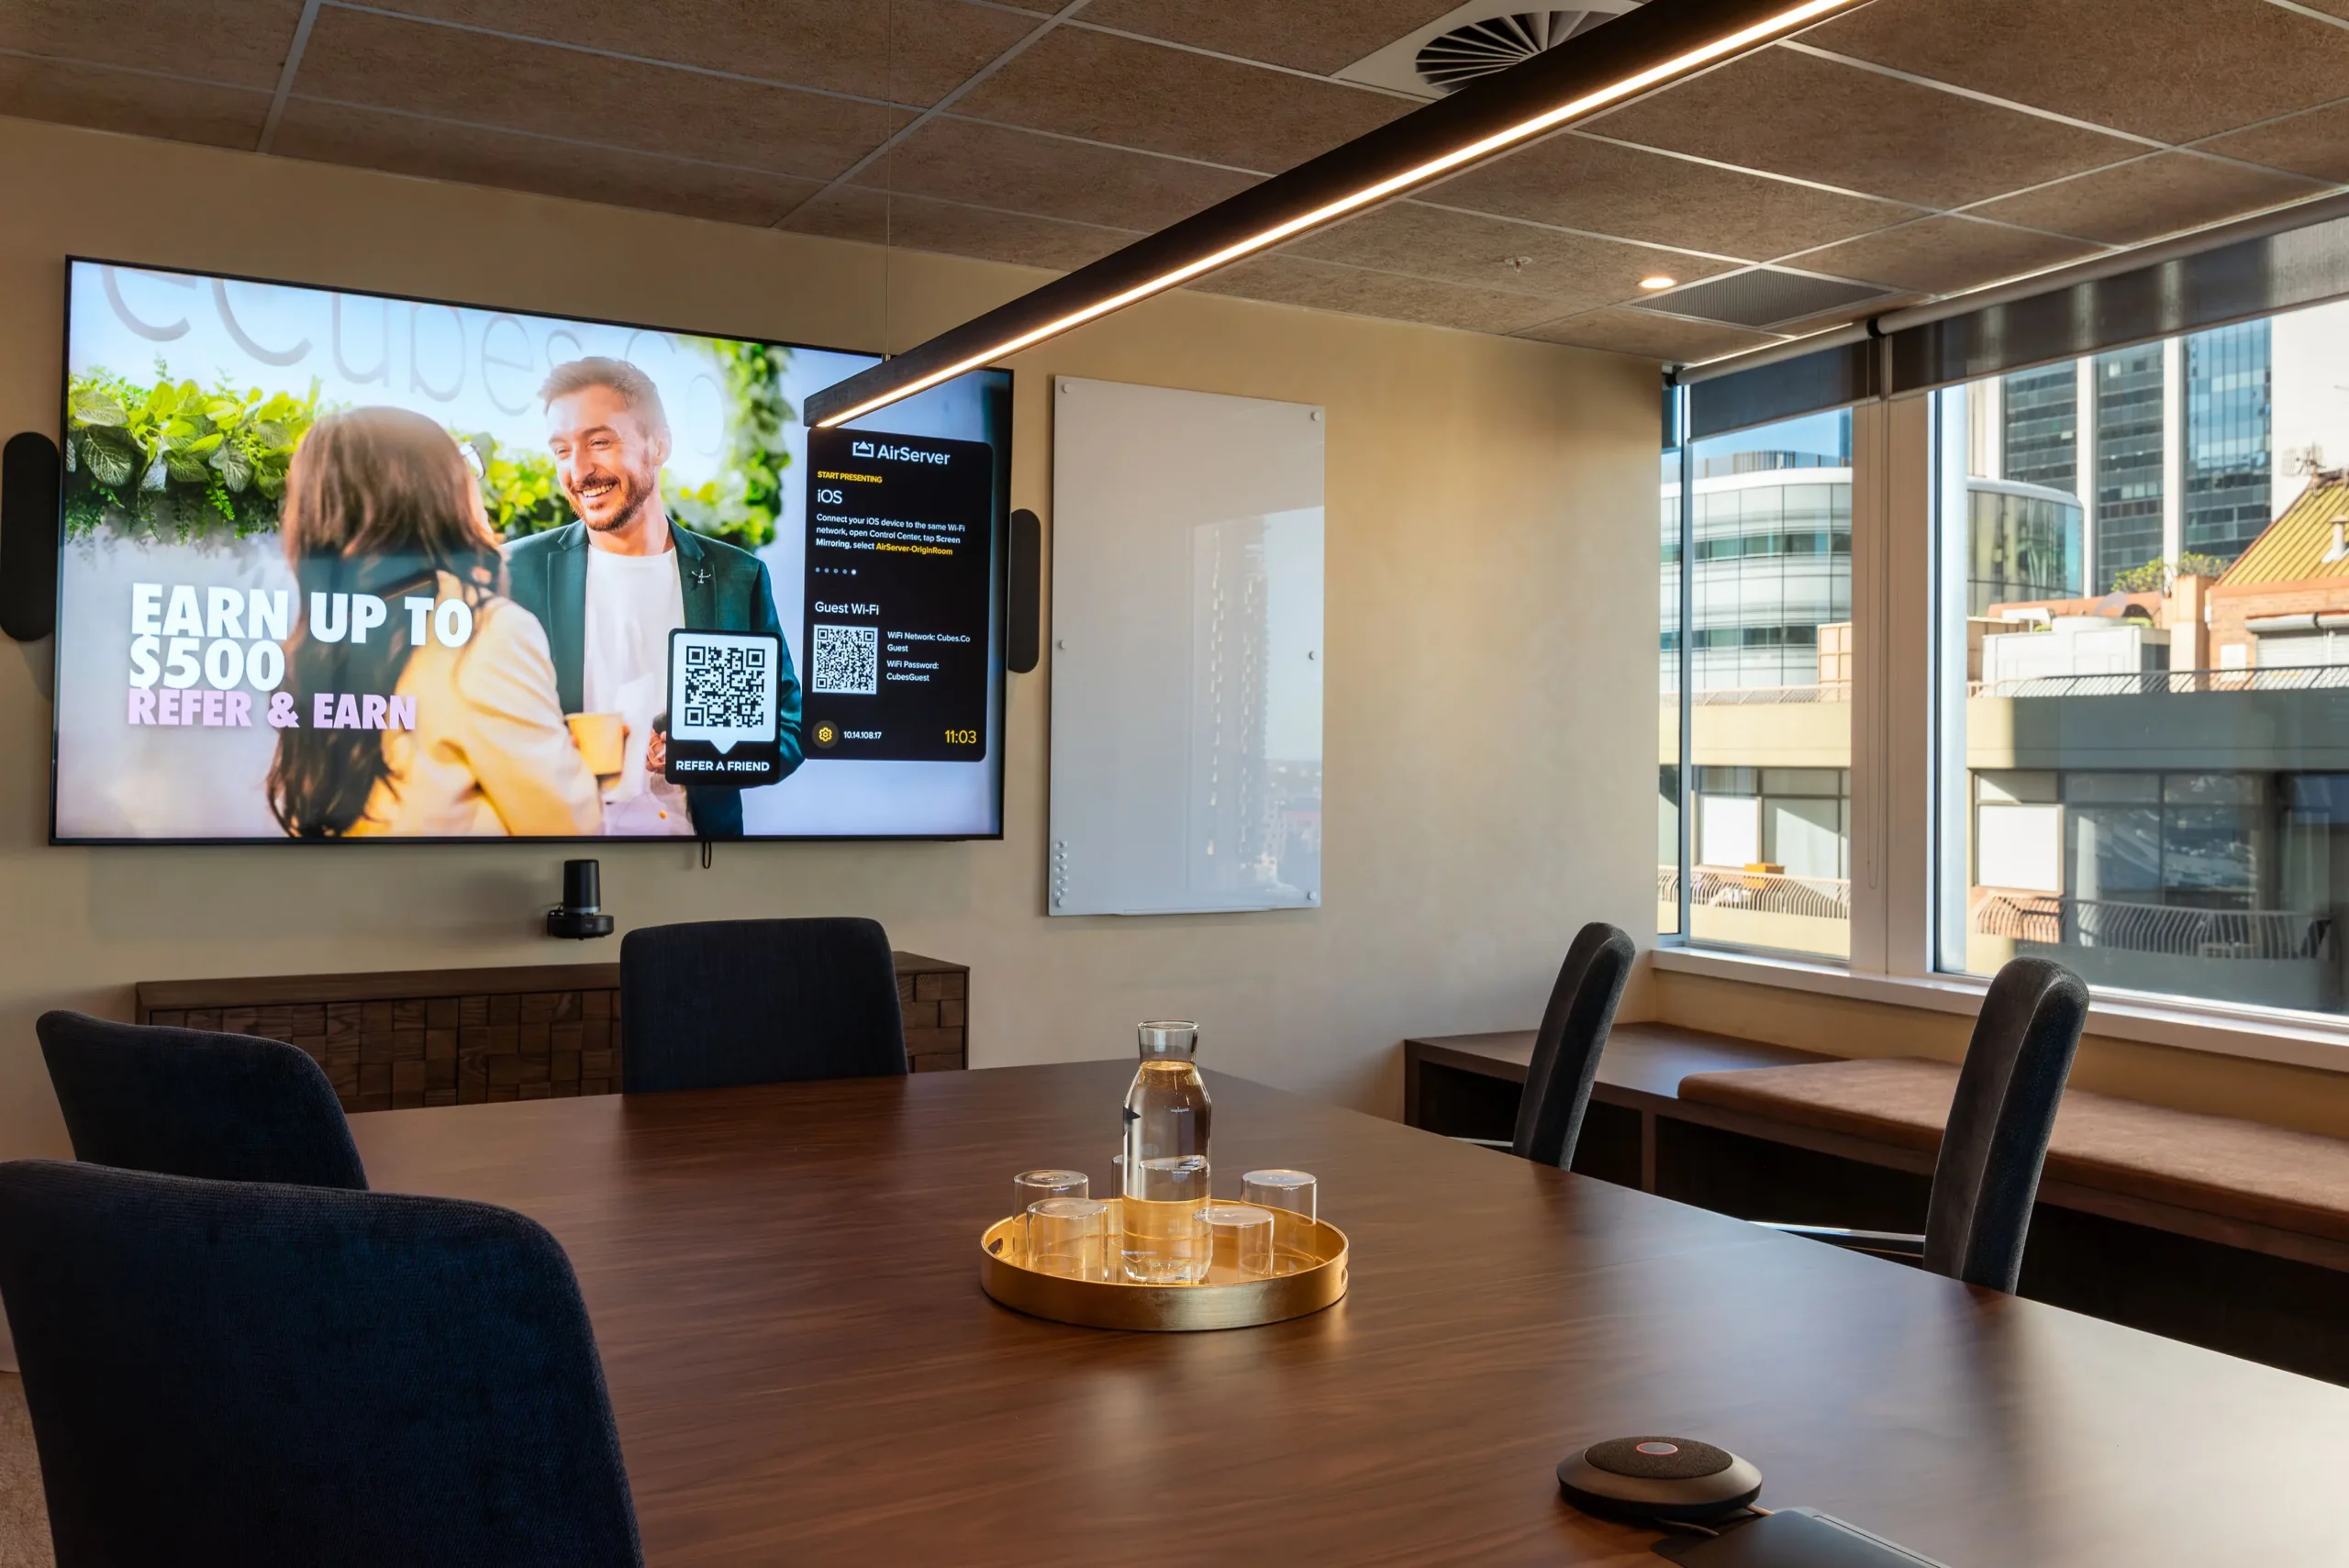
5. Meeting room utilisation and room fit
Assess meeting rooms separately from desks. Track both the time a room is used and how well its size matches the meeting.
Room time utilisation: Actual occupied room-hours ÷ available room-hours × 100.
Seat occupancy during a meeting: Attendees ÷ room seating capacity × 100.
A 12-person boardroom regularly used by two people may have strong time utilisation but poor capacity fit. That pattern could support creating smaller rooms while retaining larger spaces for meetings that need them.
Also track instances where employees cannot find an appropriate room.
What it reveals: Whether the office has the right mix of meeting spaces, quiet rooms and collaboration areas.
An office can have plenty of spare capacity overall while lacking the specific spaces employees need.
6. Booking no-show rate
Bookings indicate intended demand. Actual use reveals realised demand.
Formula: Bookings with no actual use ÷ total valid bookings × 100.
Define what counts as a no-show and exclude bookings cancelled within your agreed policy. Assess desks and rooms separately.
A high no-show rate can make an office appear fully committed while usable space remains empty. Check-in reminders and automatic release of unused reservations are options to assess before adding capacity.
What it reveals: Whether booking behaviour is creating artificial shortages.
7. Cost per occupied desk-day
Cost per occupied desk-day connects workplace demand with the cost of supplying it.
Formula: Total workplace cost for the period ÷ occupied desk-days during that period.
Define the denominator clearly. If a desk used at any point counts as one occupied desk-day, apply that rule consistently. For greater precision where visits vary in length, use cost per occupied desk-hour.
Include relevant:
- Rent and outgoings.
- Utilities, cleaning and maintenance.
- Furniture and technology.
- Workplace support services.
Treat fitout and transition costs consistently across the options being compared.
What it reveals: How workplace costs relate to actual use.
Pair this metric with service quality and employee experience. A corporate office also supports meetings, clients and community, so desk use alone does not capture its full value.
How to collect workplace utilisation data
Use complementary sources to build a more reliable picture.
| Data source | Useful for | Main limitation |
|---|---|---|
| Access records | Daily attendance patterns | Entries alone do not show departure times or desk use |
| Booking systems | Intended demand and reservations | Bookings may not become actual use |
| Occupancy sensors | Presence patterns by time and zone | Coverage and accuracy need validation |
| Manual observations | Checking counts and room fit | Sampling can miss short visits and peaks |
| Employee feedback | Understanding why spaces work or fail | Feedback does not directly measure occupancy |
Start with a representative period, such as eight to twelve weeks. Extend it if holidays, seasonal activity or organisational changes distort the picture.
Use the same operating hours and definitions across sites so comparisons remain meaningful.
Explain the purpose of measurement to employees and favour aggregated reporting for workplace planning. Occupancy data should not be treated as a direct measure of individual productivity.
Turn office utilisation data into workplace decisions
Interpret the metrics together, then investigate the likely cause.
| Pattern | What to investigate | Potential response |
|---|---|---|
| Low average and low peak occupancy | Persistent excess capacity | Assess a smaller base office |
| Low average but high recurring peaks | Concentrated attendance | Coordinate team days and test overflow options |
| Empty desks but scarce meeting rooms | Space mix mismatch | Reconfigure space or add bookable rooms |
| Heavy bookings but frequent no-shows | Reservation practices | Improve check-in and release rules |
| Low attendance at one location | Travel friction and local needs | Trial workspace closer to affected teams |
| Demand changes with project cycles | Short-term capacity requirements | Compare flexible workspace options |
Include HR feedback on concentration, accessibility, collaboration and the ease of finding appropriate space.
A higher utilisation figure is not a success if employees struggle to work effectively.
When flexible workspace is a better fit
Flexible workspace is worth evaluating when your organisation needs a reliable base but demand varies beyond that core requirement.
This may include:
- A smaller private office with additional meeting space.
- Workspace for a temporary project team.
- Additional capacity during recruitment or expansion.
- Access to locations that better suit a distributed workforce.
Compare options against the same expected attendance, peak demand and service requirements.
Include membership fees, meeting room charges, additional services, transition costs and any continuing lease obligations. Validate availability on the days your people need it most.
For enterprise teams, also confirm privacy, IT requirements, accessibility, branding needs and the provider’s ability to accommodate future changes.
Flexible workspace should demonstrate a practical operational fit and a credible total cost case.
How CorporateCubes.Co supports the conversation
CorporateCubes.Co offers workspace options including private offices, day offices, meeting rooms and business lounges. Its Footscray workspace illustrates that mix, while its Business Lounge membership provides access to a national network of shared workspaces.
Availability, inclusions and terms should be confirmed for your preferred location and arrangement.
Bring your utilisation findings into that conversation. Knowing your regular attendance, busy-day requirements and meeting patterns makes it easier to assess a suitable solution.
Build a workplace around how your team works
Office utilisation gives workplace and HR leaders a stronger basis for decisions about capacity, layout and location.
The most useful dashboard combines average use, busy-period demand, room fit, booking behaviour and cost with employee feedback. Use that evidence to identify what your people need, test a suitable change and measure the result.
Ready to review your corporate office space? Explore CorporateCubes.Co and discuss a workspace solution aligned with your team’s attendance, collaboration needs and growth plans.
FAQs
What is the difference between office occupancy and office utilisation?
Office occupancy measures how many people or desks are present or in use at a particular time. Office utilisation considers use across a defined period, such as the proportion of available desk-hours occupied. Definitions vary between systems, so state the method used in your reports.
What is a good office utilisation rate for a hybrid team?
There is no single rate that suits every organisation. A useful target must account for peak demand, work activities, room availability and employee experience. Assess whether the workplace meets those needs without persistent excess capacity or recurring shortages.
How do you calculate office utilisation?
For time-based desk utilisation, divide occupied desk-hours by available desk-hours and multiply by 100. For example, 200 occupied desk-hours out of 500 available desk-hours equals 40% utilisation. Use actual use where possible, rather than bookings alone.
Does low office utilisation mean we should reduce office space?
Not necessarily. Low averages can hide busy periods, unsuitable layouts or booking problems. Review peaks, room demand and employee feedback before deciding whether to reduce space, reconfigure it or change attendance arrangements.
How often should workplace utilisation be reviewed?
A practical starting point is a weekly review of attendance and capacity issues, with a monthly management dashboard. Reassess the wider workplace strategy before lease decisions and after material changes to headcount or hybrid work arrangements.
Can flexible workspace reduce the cost of underused offices?
It can where the arrangement reduces unnecessary fixed capacity and meets actual demand. Savings depend on pricing, inclusions, extra charges and existing property obligations. Compare total costs over the same period and test access during busy days.
Can office utilisation data measure employee productivity?
Not on its own. Presence does not show work quality, output or contribution. Use utilisation data to improve the workplace, alongside separate measures of team outcomes and employee experience.
Is CorporateCubes.Co suitable?
CorporateCubes.Co is a great option for agencies seeking serviced workspace and access to professional meeting facilities. Varied options on the selected location, office configuration and your requirements are seamlessly managed. Confirm your needs, privacy, storage and technical arrangements during a tour.